.jpg)
Speaker intro
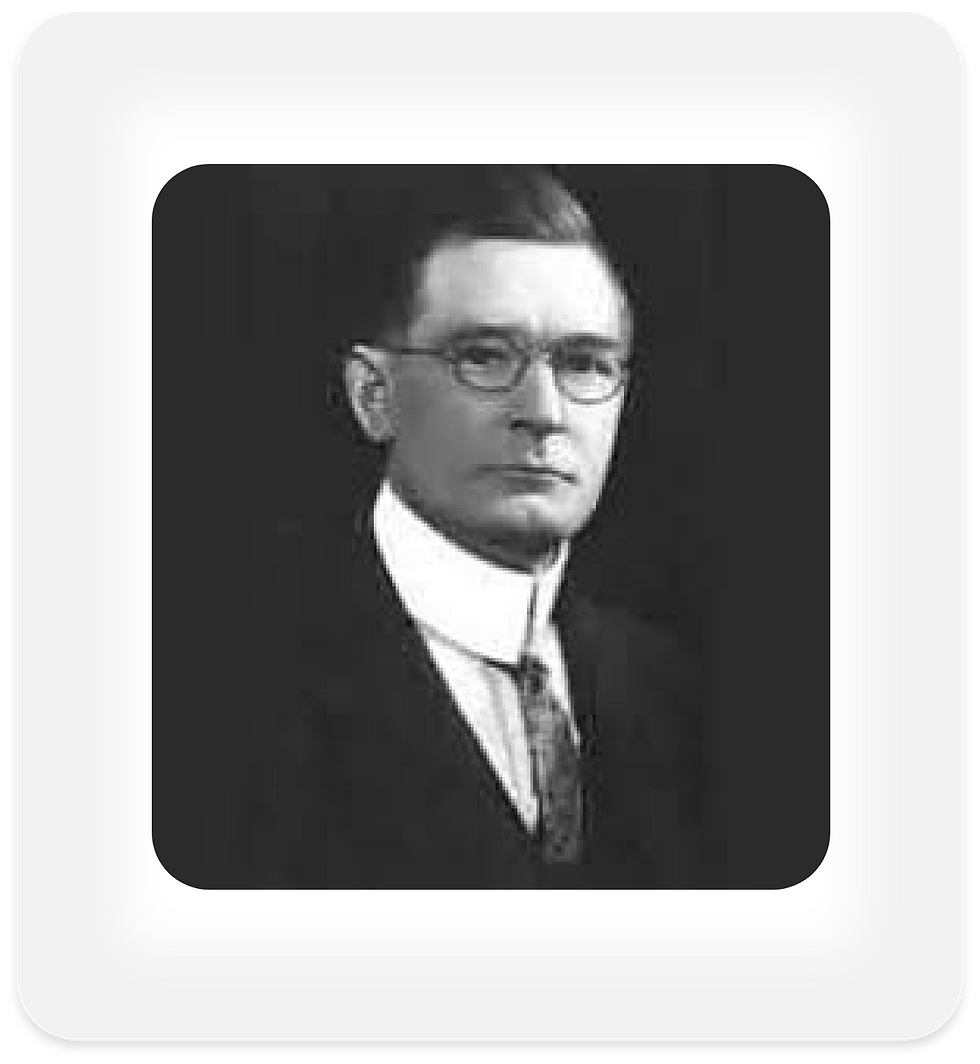
Ashok Devanampriya
Ashok Devanampriya is the CEO and Founder of Cautilya Capital.
He is also the Co-founder of www.tradersgurukul.com with a mission to help retail Investors & traders in India in pursuit of their simplified financial knowledge
He also established Titan Trader www.titantraders.in One of the emerging proprietary trading firms in south India.

Hassle Free Investments
Source
SEBI ( India )
Zerodha CEO
(Nithin Kamath)
US Day Trading Study
(Barber et al)
Taiwan Study
(2004)
Statistic
89% of active traders incurred losses (2021–22 data across 45 lakh individual traders)
"Less than 1% of intraday traders make consistent money"
97% of active day traders lose money over time
1% of traders capture 80% of the profits
Conclusion
Only 11% made profits
99% lose or break even
Only 3% are net profitable
Most retail traders are net contributors to the top 1%
Who can make money in markets?
Hassle Free Investments

The Disciplined Strategist:
Those who follow a system—be it SIPs, swing trading, or long-term investing —and stick to it without letting emotions interfere, consistently grow wealth.

The Patient Investor:
People who understand the power of compounding and stay invested for 10, 20, or even 30 years, ignoring short-term noise, create generational wealth.

The Risk-Manager, Not the Risk-Taker:
The real pros don't chase jackpots—they manage risks smartly, cut losses early, and protect their capital like a warrior guarding treasure.
.jpg)
0.01% vs 99.99%
Data Integrity matters
999 out of 1000 of investors and traders focus on Price only
1 out of 1000 of the investors and traders only will focus on Time.
Time is the most powerful thing in the stock market.
10% of the time Cycle players understand the power of Quant.
1 in 10000 people only works on the combo of Time & Quants
.jpg)
The power of Time
What is TQRPS?
-
Strategic asset allocation Investing model using time cycles
-
Quant + Seasonality + Portfolio rebalancing Engine
-
100% Automatic
-
Identifying the best momentum time using AI
-
Low churn, high conviction & benchmark beating system
The power of Time
Welcome to the world of Time Cycles
-
A cycle is an event, such as a price high or low, which repeats itself on a regular basis.
-
Cycles exist in the economy, in nature and in financial markets.
-
The basic business cycle encompasses an economic downturn, bottom, economic upturn, and top.
-
Cycles in nature include the four seasons and solar activity (11 years).
-
Cycles are also part of technical analysis of the financial markets.
-
Cycle theory asserts that cyclical forces, both long and short, drive price movements in the financial markets.
The Power Of Time Cycles
Start date | End Date | Start Price | End Price | Profit |
|---|---|---|---|---|
21 Nov 2016 | 30 Dec 2016 | 25765.14 | 26626.46 | 861.32 |
20 Nov 2017 | 1 Jan 2018 | 33359.90 | 33812.75 | 452.85 |
20 Nov 2018 | 31 Dec 2018 | 35474.51 | 36068.33 | 593.82 |
20 Nov 2019 | 30 Dec 2019 | 40651.64 | 41558.00 | 906.36 |
20 Nov 2020 | 30 Dec 2020 | 43882.25 | 47746.22 | 3863.97 |
22 Nov 2021 | 30 Dec 2021 | 58465.89 | 57794.32 | -671.57 |
21 Nov 2022 | 30 Dec 2022 | 61144.84 | 60840.74 | -304.10 |
20 Nov 2023 | 1 Jan 2024 | 65655.15 | 72271.94 | 6616.79 |
20 Nov 2015 | 30 Dec 2015 | 25868.49 | 25960.03 | 91.54 |
20 Nov 2014 | 30 Dec 2014 | 28067.56 | 27403.54 | -664.02 |
20 Nov 2013 | 30 Dec 2013 | 20635.13 | 21143.01 | 507.88 |
20 Nov 2012 | 31 Dec 2012 | 18329.32 | 19426.71 | 1097.39 |
21 Nov 2011 | 30 Dec 2011 | 15946.10 | 15454.92 | 491.18 |
22 Nov 2010 | 30 Dec 2010 | 19957.59 | 20389.07 | 431.48 |
20 Nov 2009 | 30 Dec 2009 | 17021.85 | 17343.82 | 321.97 |
20 Nov 2008 | 30 Dec 2008 | 8451.01 | 9716.16 | 1265.15 |
20 Nov 2007 | 31 Dec 2007 | 19280.80 | 20286.99 | 1006.19 |
20 Nov 2006 | 2 Jan 2007 | 13430.71 | 13942.24 | 511.53 |
21 Nov 2005 | 30 Dec 2005 | 8610.74 | 9397.93 | 787.19 |
22 Nov 2004 | 30 Dec 2004 | 5963.80 | 6522.54 | 558.74 |
20 Nov 2003 | 30 Dec 2003 | 4771.23 | 5791.85 | 1020.62 |
20 Nov 2002 | 30 Dec 2002 | 3075.48 | 3374.97 | 299.49 |
20 Nov 2001 | 31 Dec 2001 | 3231.66 | 3262.33 | 30.67 |
Time was their trump card
The Legends who ruled Cycles